This project aims to extract insights about products sold on Amazon using publicly available data found in Amazon product listings. Due to the immense amount of products available on Amazon, I narrowed down the project to focus on Camping & Hiking related products. The goal is to identify characteristics that differentiate best selling products from the rest, which could serve as useful information for Amazon sellers. The process involved scraping the intial datset from Amazon.com, cleaning and preprocessing the scraped data, and finally analyzing it for insights.
Data Scraping
I used the requests_html library in python to scrape the product data. The data was scraped using three different URL’s: one found by typing “Camping & Hiking” in to the Amazon search bar, another found by using the drop-down navigation options in Amazon get to Camping & Hiking products, and another which listed only the top one hundred bestselling Camping & Hiking products. I found it necessary to include the last link because regular searches only inlcude a small amount of bestselling products on their results’ page, and I wanted to have more bestselling products in the dataset for analysis. The URL found by navigating to Camping & Hiking products included many more pages of results than by searching directly in the search bar, so using two URL’s to search for regular products (by regular I mean not bestselling) helped to add more products to the dataset.
The data was scraped from the product listings on the search results page rather than individual product pages. The following data was included for all products when available:
Product Title
ASIN (a unique identification number for each Amazon product)
Price
Star Rating (out of 5 stars)
Number of Reviews
Best Seller indicator (for products not found on the best sellers page, this was marked by a “Best Seller” tag in the product image)
Products listed on the best sellers page included a little less information in their listings. The following are data that was collected for products on regular search results pages but not the best sellers list. Because this data was only available for a portion of the dataset, I focused my analysis on the previously listed variables and used the following data variables as supplementary information.
Number of the product bought in the past month
Free delivery availability (products listed as having free delivery)
Coupon availability (products that included a coupon)
Page Number (this information was technically available for products on the bestsellers page but wasn’t as meaningful to collect since the bestsellers page was an ordered list of products from 1 to 100)
Some of the data was extracted using patterns in the product text and the requests_html .search() functionality. For example, product star ratings were always written in the form “{rating} out of 5 stars”, so this information was easy to extract directly in python before putting the data in a dataframe. Other information like free delivery and coupon availability was extracted from the entire text output in the cleaning and preprocessing stage. Most of the data was extracted from each product listing’s text output except for the title and ASIN. The ASIN was not displayed in the product text, so I pulled into from another part of the html. The title was displayed in the product text but due to each title’s differing length and verbage, I found it easier to extract the complete title from another part of the html. “Try” and “except” was used to keep the scraper running when a product didn’t display certain information, and ‘NA’ was inserted for unavailable data.
response=session.get(url)response.html.render(sleep=2)products=response.html.find(parent_selector)whilepage_number<50:forproductinproducts:product_inf={}try:asin=str(product)asin=asin[asin.find('amzn1.asin.')+11:]asin=asin[:asin.find("'")]product_inf['asin']=asinexcept:product_inf['asin']='NA'try:title=product.find(title_sel)title=str(title)title=title[title.find('label=')+7:title.find('class=')-2]product_inf['title']=titleexcept:product_inf['title']='NA'try:number_bought=str(product.search('{number} bought in past month')['number'])[-4:]product_inf['number_bought']=number_boughtexcept:product_inf['number_bought']='NA'try:rating=str(product.search('{number} out of 5 stars')['number'])[-3:]product_inf['rating']=ratingexcept:product_inf['rating']='NA'try:number_reviews=str(product.search('aria-label="{number} ratings"')['number'])[-9:]product_inf['number_reviews']=number_reviewsexcept:product_inf['number_reviews']='NA'try:product_inf['page_number']=page_numberproduct_inf['text']=product.textexcept:product_inf['text']='NA'data.append(product_inf)page_number+=1url=response.html.next()else:df=pd.DataFrame(data)
Cleaning and Preprocessing
Cleaning and preprocessing this dataset involved removing excess characters from the html element attached to pieces of the data, creating columns for data extracted from the full product text string, and converting number types from string to integers or floats. The final result of cleaning and preprocessing was two datasets: one dataset with the variables available for all products including products from the best sellers list, and another datset without products from the best sellers list with additional variables like number bought, coupon availability, and free delivery availability.
The columns for products offering free delivery and coupons were binary 1 and 0 columns. A 1 in the free delivery column meant that free delivery was available, and a 1 in the coupon column meant that a coupon was available. The column indicating if a product was a best seller was also a binary 1 and 0 column, with 1 indicating that the product was a best seller. These features were determined by looking for the terms ‘FREE Delivery’, ‘coupon’, and ‘Best Seller’ in the full product text string.
The price, rating, number of reviews, and number of a product bought in the past month needed to be converted to integer and float values from their original text data types. Additionally, the number bought in the past month was usually written in the format “8k+” for thousands and “300+” for hundreds. Additional chracters like the “k” and “+” needed to be removed, and numbers in the thousands needed to be converted from the “8k” format to “8000” while changing the data type to an integer.
Another column that I added was a column for the number of words in each product title. I did this by splitting the title string into words and counting the number of words. This will be used later to evaluate if products with longer titles including more keywords are more likely to be best sellers.
Lastly, when datasets that were extracted from different URL’s were merged, the ASIN was used to removed duplicate products.
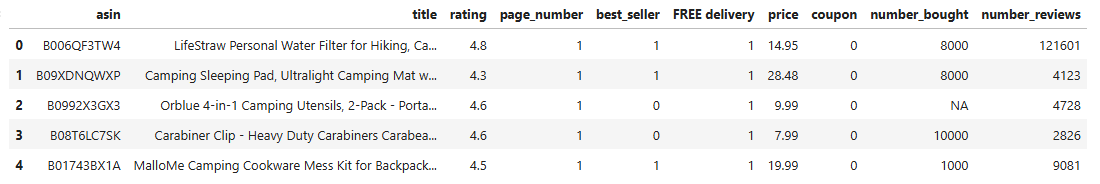
Each dataset was stored as a pandas dataframe. The original, non-cleaned datasets of scraped data were retained as backups, and cleaned datasets were stored as new dataframes. A snippet of each cleaned and preprocessed dataframe can be seen below.
Analysis
Price, Rating, Number of Reviews, and Number of Words in the Title
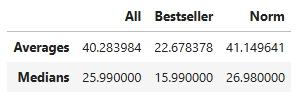
I started by doing univariate analysis of key numeric variables available for all products. This included price, star rating, number of reviews, and number of words in the title. I calculated the distribution, average, and median of these values across all products, best selling products, and “normal” products. In this case, by normal I mean that the product wasn’t listed as a best seller.
Analysis results show that the average price of best selling products is lower than that of normal products ($22.67 vs. $41.15). The avearge price across all products was $40.28.
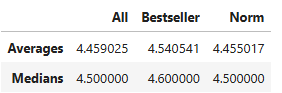
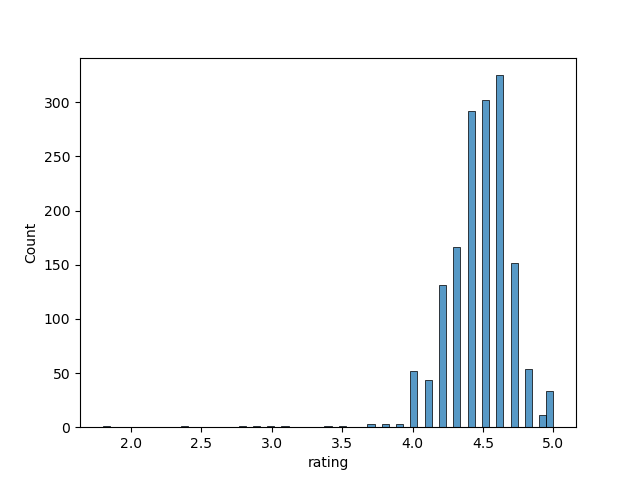
The star rating across all products was 4.46 on average. The average rating was slightly higher for best sellers but not by much.
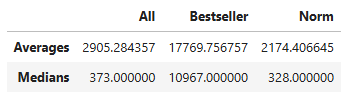
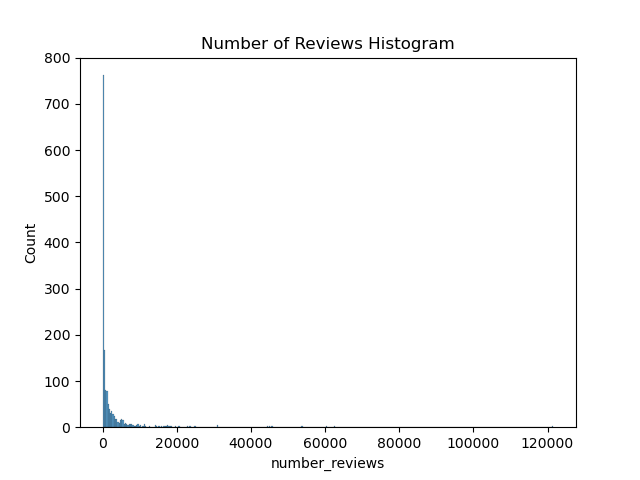
Best selling products in this dataset got more reviews than normal products. The median number of reviews for best selling products was 10,967 while the median number of reviews for normal products was 328.
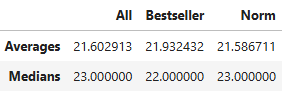
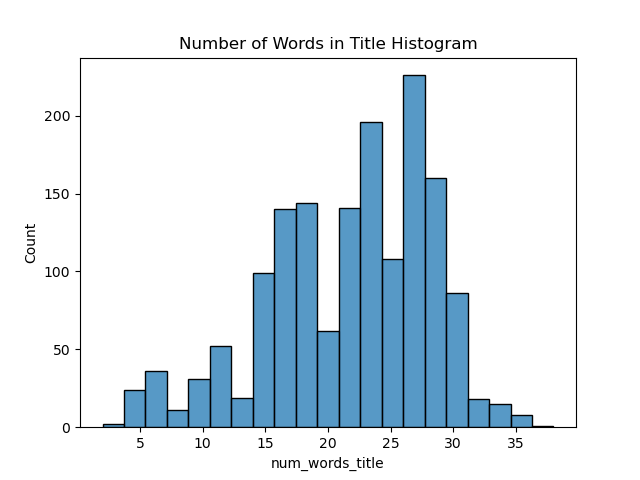
Across all products, the average and median number of words in the title was about 22. There was not a noticeable difference between the title length of best selling products and normal products.
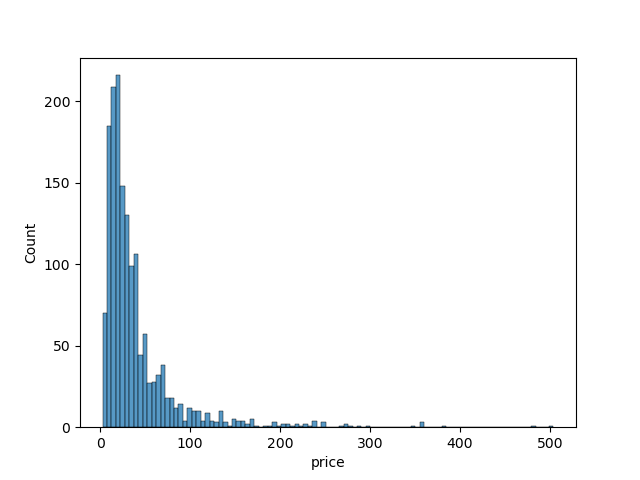
Price
Rating
Number of Reviews
Number of Words in Title
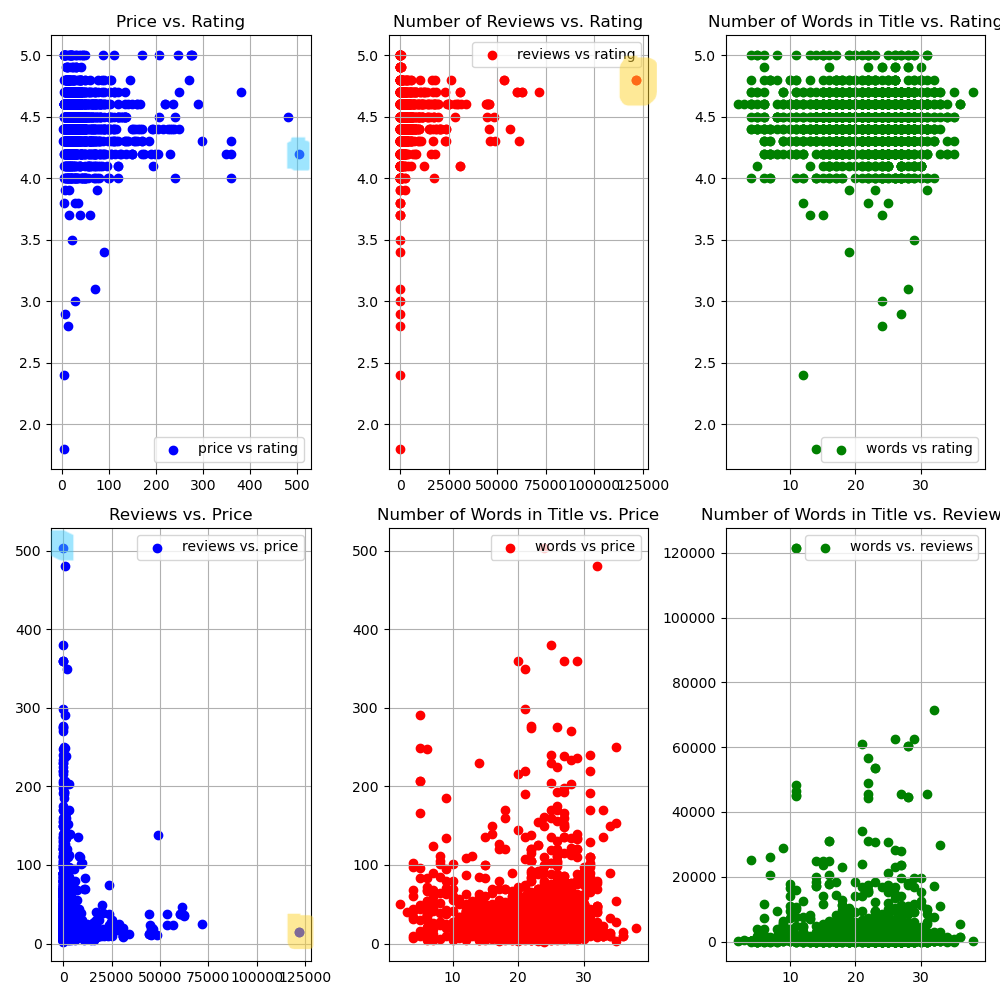
Next I did bivariate analysis to compare these variables with each other, and used scatterplots to visually analyze variable relationships.
The results showed that products with a higher number of reviews appeared to be priced lower (under $50). The highest priced products got very few reviews.
The most expensive product in the dataset is a Retevis RT29 two-way, long-range radio. It has a 4.2 out of 5 star rating, is priced at $503.99, and has 33 reviews.
The most reviewed product is a best seller priced at $14.95. It is the LifeStraw Personal Water Filter for Hiking & Camping. It has a 4.8 out of 5 star rating with 121,601 reviews. This is far more reviews than any other product in the dataset.
Additionally, products with 5 star ratings tend to very few reviews. Based on the scatterplot of number of reviews vs. star rating, the most reviewed products have star ratings between 4.3 and 4.7. There were 33 products with 5 star reviews, many of which had less than 20 reviews. The 5-star-rated product with the most reviews was an an adidas 5-star 2.0 multi-use Teawm Backpack priced at $36.84.
The lowest-reviewed product was the “Generic Orienting Compass” with only 5 reviews and a 1.8 star rating.
The number of words in a product’s title did not seem to have a very significant impact on price, star rating, or the number of reviews a product received.
The scatterplot below visualizes the relationship between these variables. The point for the most expensive productis marked in blue, and the point representing the most-reviewed product is marked in yellow.
Next, I looked at the additional variables only available for products from regular search results and not the best sellers list using the dataset with only products from regular searches. This dataset includes a small proportion of best sellers.
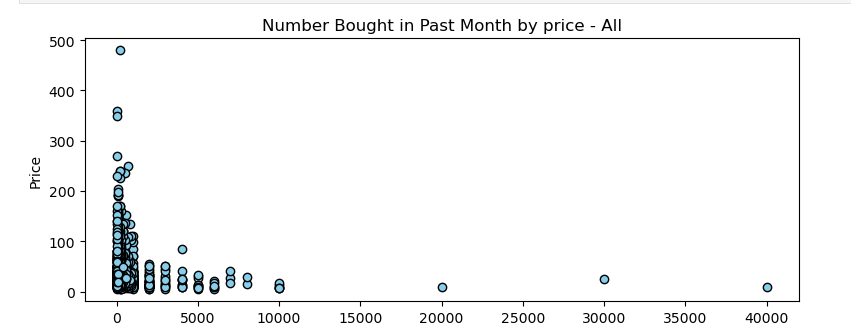
Number Bought in the Past Month
There were 980 products displaying the number bought in the past month. Across all prodcuts displaying this information, the average number of a product bought in the past month was 738, and the median was 200. For best sellers, the average number of a product bought in the past month was 2788, and the median was 2000. For normal products the average was 704, and the median was 200.
When comparing the number bought in the past month with price, lower-priced items sold more. The item that had sold the most in the past month at the time I scraped this data was a 10 pack of cliganic mosquito repellent bracelets priced at $9.49 which had sold 40k+ units in the past month.
Free Delivery
99.8% of all products in the dataset were eligible for free shipping (usually with purchases totaling $35 or more). In fact, only three products did not offer free shipping. I compared the average and median price, rating, and number of reviews for products eligible for free shipping and those that aren’t, but due to the very small portion of the datset that did not offer free shipping, it is not clear if free shipping has an effect on these variables.
Coupon
4.6% of all products offered a coupon (72 products). The average price of products offering coupons in this dataset was lower than that of products without coupons ($33.01 and $41.32 respectively), but the median price of products offering coupons was higher than that of products without coupons ($29.58 and $26.94 respectively).
The ratings for products with and without coupons were very similar: 4.47 stars with a coupon on average and 4.46 without a coupon on average. The median star rating was 4.5 with and without a coupon.
The average number of reviews for products with a coupon was 2247 and 2289 without a coupon. The median number of reviews with a coupon was 257 and 344 for product without a coupon.
Text Analysis
One of the tools available to Amazon product sellers is choosing the title and keywords displayed on their product listing to help their product appear in more search results. This will hopefully lead to more exposure for their product and, subsequenty, more sales. As noted earlier, the average number of words in each title for the products in this dataset was 22. This did not differ between best selling and normal products.
The following text analysis further explores which words are present most often in product titles. The analysis breaks down most common terms by singular words (1-grams), sets of two words together (2-grams), sets of three words together (3-grams), and sequences of four words together (4-grams) and counts the occurences of each n-gram. I used the nltk library and collections library to tokenize the each title, remove stopwords like “and” and “with”, and count the frequency of each n-gram. I did decide to keep the word “for” which is usually removed as a stopword. I did this because many Amazon sellers include a phrase like “for Men”, “for Women”, or “for Camping” in their product titles, and I wanted to be able to evaluate these phrases. A snippet of the code I used for text analysis can be seen below.
Even with best sellers added from the best sellers list, there were less best selling product titles to analyze than normal product titles. There were a total 74 best selling product titles and 1513 normal product titles. Because of this, the most popular n-grams across all products and “normal” products were very similar. The following tables show the top ten most popular n-grams among best selling products, normal products, and all products.
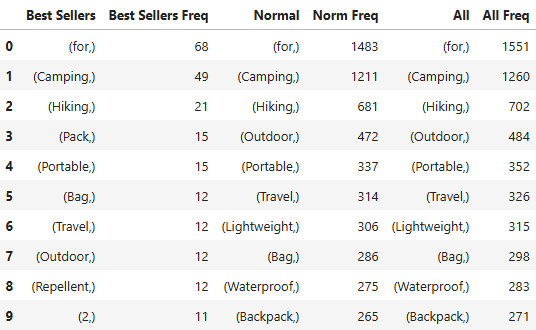
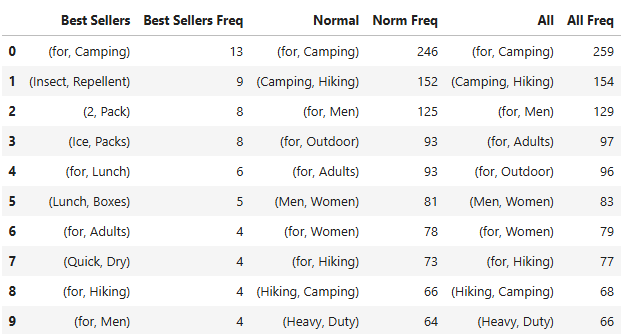
1-grams
2-grams
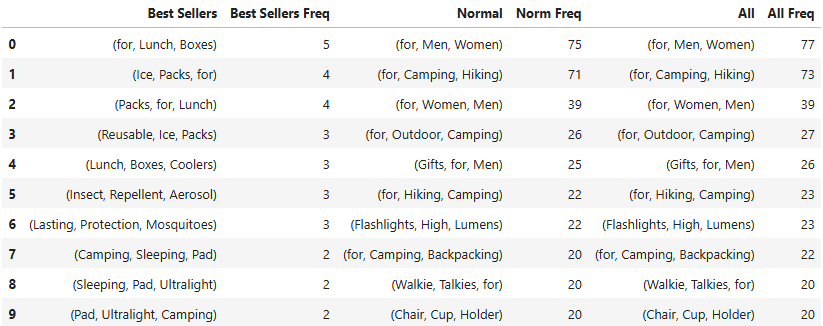
3-grams
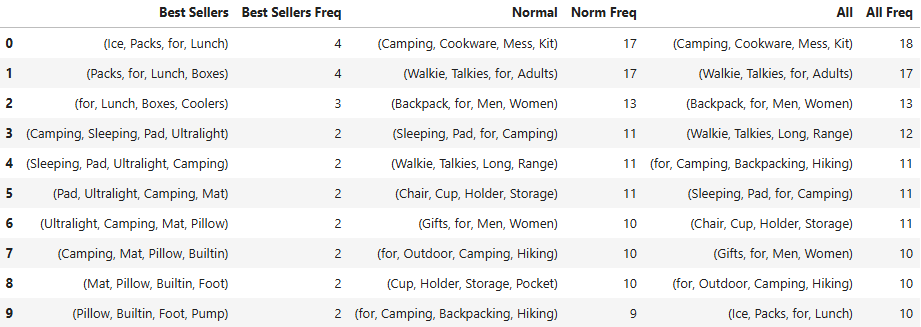
4-grams
The most common word to appear in product titles was “for”. The word appeard in 97.7% of product titles in this dataset.
Some phrases with the word “for” were more common than others. The most common phrase across all products, was “for Camping”. The phrase “for Camping” (259) appeared more often than “for Hiking” (77). “Camping” and “Hiking” often appeared together, and phrases including the words “for”, “Camping”, and “Hiking” were also common. However, it is more likely to see these words with “Camping” listed before “Hiking”.
Other popular “for” phrases included phrases identifying who the target product customer. The phrases “for Men” (129), “for Women” (79), and “for, Men, Women” (77) were all popular phrases, with “for Men” being more likely than “for Women”.
Phrases identifying the product purpose like “for Outdoor” (97), “for Outdoor Camping” (27), and “for, Camping, Backpacking” (22) were also common.
A few other popular words among camping and hiking product titles were “Portable” (352), “Travel” (326), “Lightweight” (315), and “Bag”(298).
The n-gram counts for only best selling product titles were quite a bit lower than the counts for normal product titles. Some of the most likely bigrams and trigrams for best selling products only were “for Lunch” (6), “Ice Packs for” (4), and “Insect Repellent” (9). Due to the small portion of best selling products in the dataset, these n-gram counts could reflect a few popular products like insect repellent or ice packs. While these are best selling products in the camping and hiking category, I speculate that these may be best selling products because they are commonly used even outside of camping and hiking.
Summary
By analyzing numeric variables, categorical variables, and title text, it was possible to extract a insights on camping and hiking products listed on Amazon.com, including a few differences between best selling and non-best selling products.
A few of the key findings include the following:
The average price across all products was $40.28, and best selling products tended to be priced lower than non-best sellling products. Lower-priced products also tended to have sold more in the past month.
The average star rating was 4.46 stars out of 5, and the majority of all products hovered around this rating.
In this dataset, best selling products tended to get more reviews than non-best selling products.
99.8% of products offered free shipping
4.6% of products offered a coupon
There were an average of 22 words in each product title.
97.7% of product titles included a “for” phrase. The most common “for” phrases were “for Camping”, “for Camping and Hiking”, “for Men” and “for Women”.
The word sequence “Camping” and “Hiking” is a more common than “Hiking” and “Camping”
One limitation of this analysis is the small number of best-selling products in the dataset. Although added more by scraping product data directly from the best sellers page, there still ended up being a small portion of best-selling product data. Due to this limitation, I wouldn’t apply the comparisons of best-selling and non-best selling products found here across all products on Amazon’s website. However, with more data, this analysis could be improved to have stronger confidence in the best selling vs. normal product comparisons.
While I focused on Camping & Hiking prodcuts, this type of analysis could be applied to products in other product categories to generate more insights on e-commerce products.