
Stock Comparison Dashboard
Published:
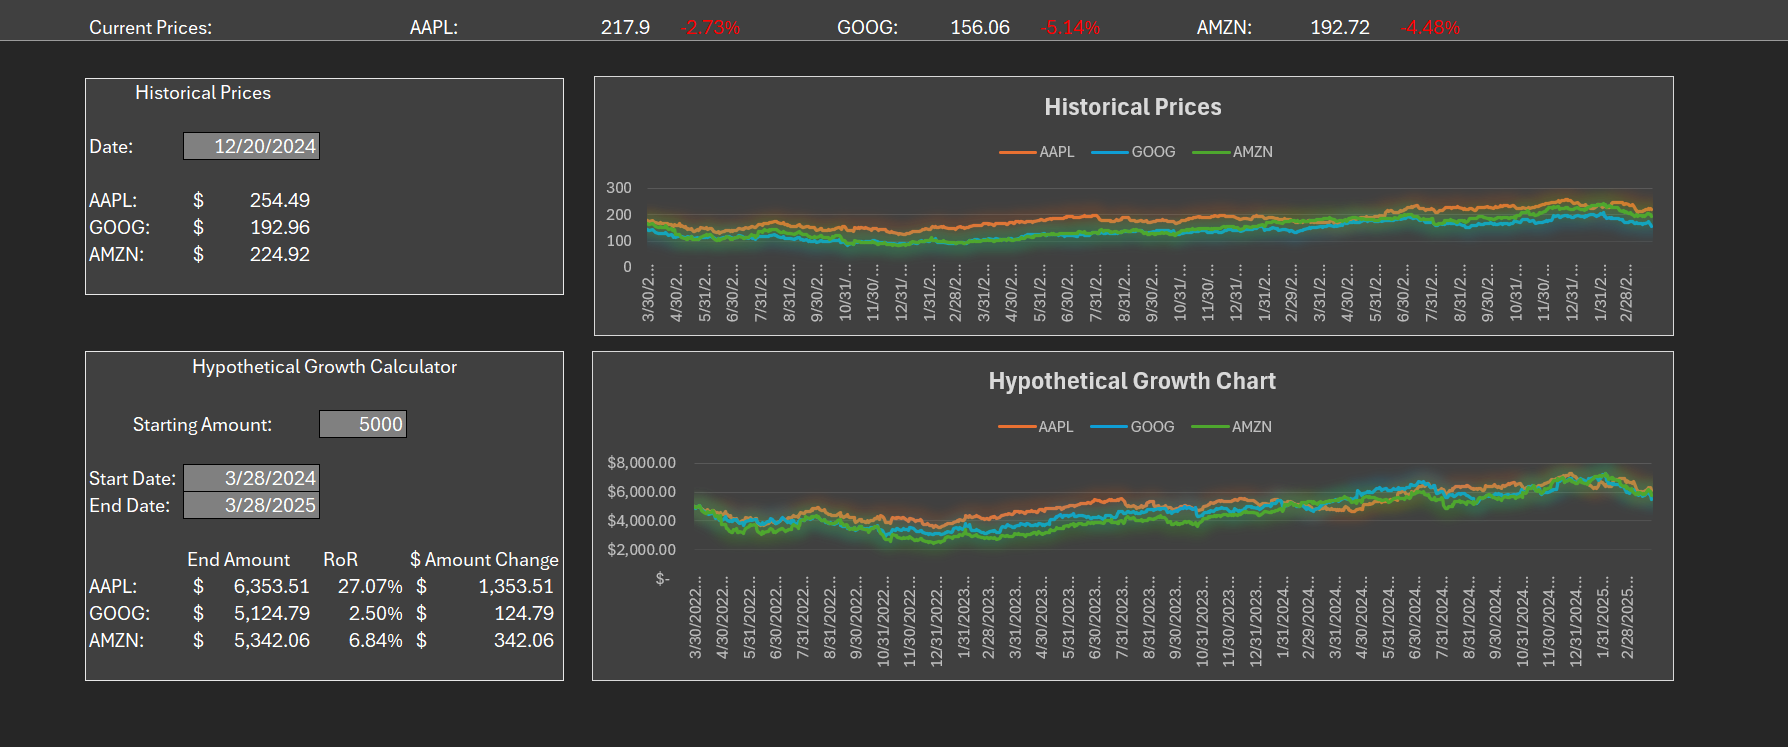
The Stock Comparison Dashboard is an Excel dashboard that automatically updates to reflect current stock prices, historical stock prices, daily changes, and hypothetical growth calculations. The dashboard uses references so that the user can change the stocks in the dashboard easily. It refreshes every five minutes so that the user always views up-to-date price data without having to do any manual updates.
Data
The dashboard uses data from Google sheets using the “GOOGLEFINANCE” function and is imported into Excel through the “Get External Data” feature in Excel. A similar dashboard could also be made directly in Google Sheets. The data includes historical prices from the last three years.
The “QUERY” function in Google Sheets is used to specify the column names. The “TODAY” function is used to access data based on the current date. Features
Current Price and Daily Change Ribbon
Ribbon at the top of the dashboard displaying the current price, updating every 5 minutes, of each stock, and the percent change from yesterday’s closing price. Each stock’s prices and percent changes update automatically using references and formulas.
Historical Price Drop Down
This section includes a data drop down that allows you to select a date and see the stock prices for each stock on the selected date. The drop down is created with the Excel Data Validation tool, and the prices of each stock are updated with a Vlookup formulas referencing the date selected in the drop down tool.
Hypothetical Growth Calculator
This section computes the hypothetical growth of an initial investment in each stock. It uses starting amount, start date, and end date user inputs. It calculates the end amount, rate or return over the investment period, and dollar amount change from the start to end date. These calculations are done using Excel formulas.
Historical Price Graph
This graph shows the change in stock prices over time using the historical stock prices downloaded into the Excel workbook from Google Sheets.
Hypothetical Growth Graph
This graph uses the percentage change for each day calculated from the historical prices multiplied by an initial investment amount inputted by the user. It uses the data from these calculations to show the hypothetical growth of an investment over time.
Stock Data Tab
The data that reads into the dashboard is stored in the stock data tab. This tab uses the ‘Get Data’ function in Excel to pull data from the published Google Sheets file. I pulled data from the Google Sheets file because stock data is free to access in Google Sheets, but the built-in stock function in Excel requires a paid subscription. The stock data tab also includes the data for the percentage change and hypothetical growth graphs and calculations. These numbers are calculated as using formulas referencing the historical price data.
Google Sheets File
The Google Sheets file uses the “GOOGLEFINANCE” function to update individual stock data. This sheet updates automatically, so when the Excel dashboard refreshes, it will pull updated data from the Google sheet, and all referenced data in the dashboard will update automatically as well.