COVID Impact on Driver Behavior
Published:
My master’s capstone project focused on evaluating changes in driver behavior before and after the COVID-19 pandemic. The pandemic came with many societal changes such as stay at home orders and increased remote work, and some Pennsylvania drivers speculated that following the pandemic, people appeared to be driving worse. My project aims to evaluate this claim. To complete this project, I identified the best metrics given my dataset to evaluate changes in driver behavior, prepared the dataset for modeling, built forecasting and difference and difference models centered around the onset of the pandemic, and interpreted model results in context of Pennsylvania driver behavior and COVID-19.
Dataset
The primary dataset for this project comes from the PennDOT crash dataset. I chose changes in the crash rate and crash rates involving specific driver behavior to use as measurement of changes in driver behavior. The PennDOT dataset contained 20 years of crash data and eight different tables for each year. Not all of the data was necessary for this project, so I filtered through the tables to extract relevant data, documenting which variables were kept and excluded. Because the data was originally separated by year, it needed to be aggregated into one table with a variable indicating the crash date and year before modeling.
I used another dataset from the CDC to identify areas with higher covid rates. I used Covid rate and population by Pennsylvania county to identify counties that could be used as “control group” counties in the difference-in-difference models. Note that this was an imperfect way to choose a control group as no county was completely unaffected by COVID, and having a more robust dataset and methodology for choosing control group counties would make the difference-in-difference models more informative.
A final dataset used for this project was a table of driver miles travelled by year. Because people drove less in 2020 due to lock down orders, I divided the crash rate for each year by the number of vehicle miles travelled (in units of 100 million) to normalize for the reduced amount of overall driving. This way reductions in the overall driving rate would cause inaccurate comparisons of the crash rate from year to year.
Data Exploration
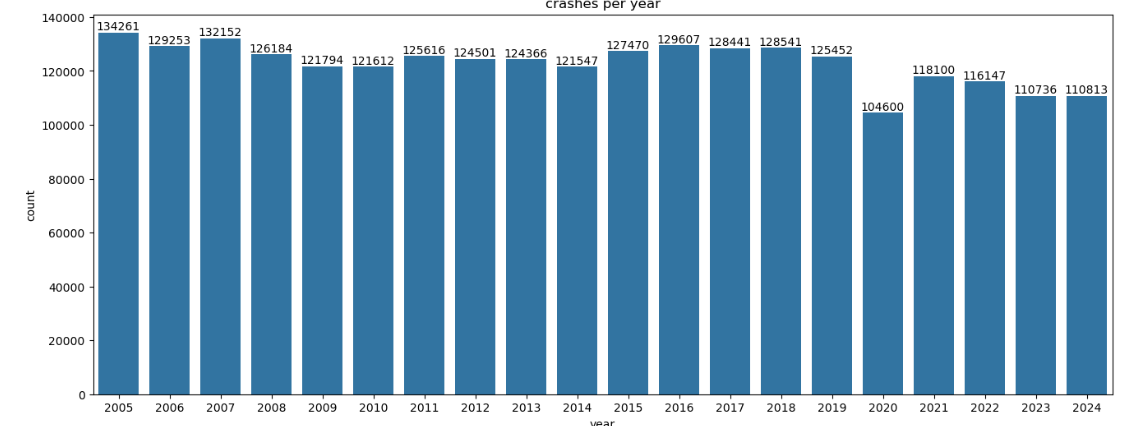
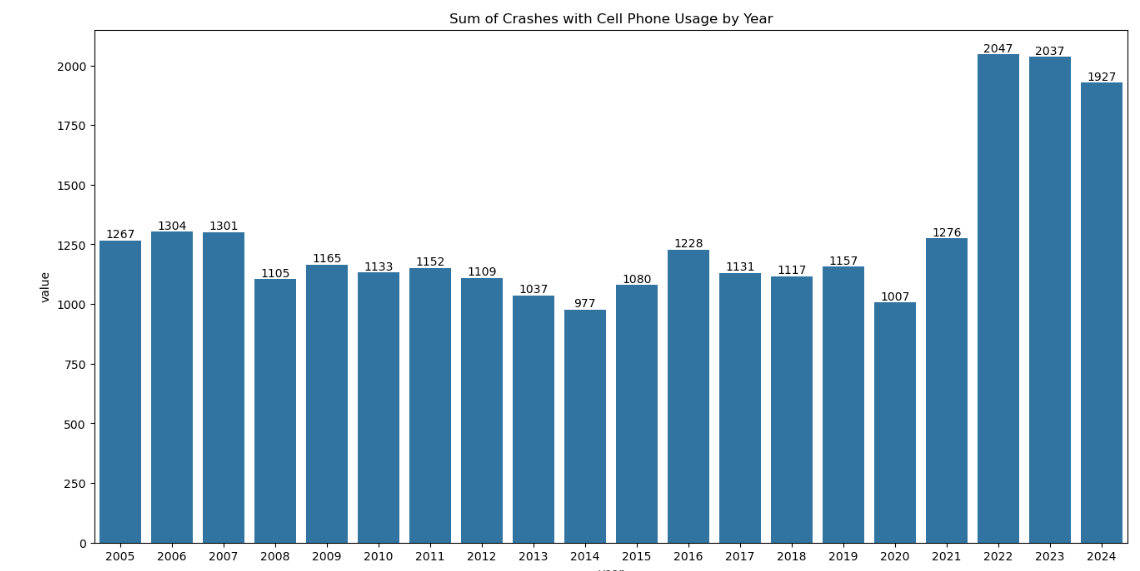
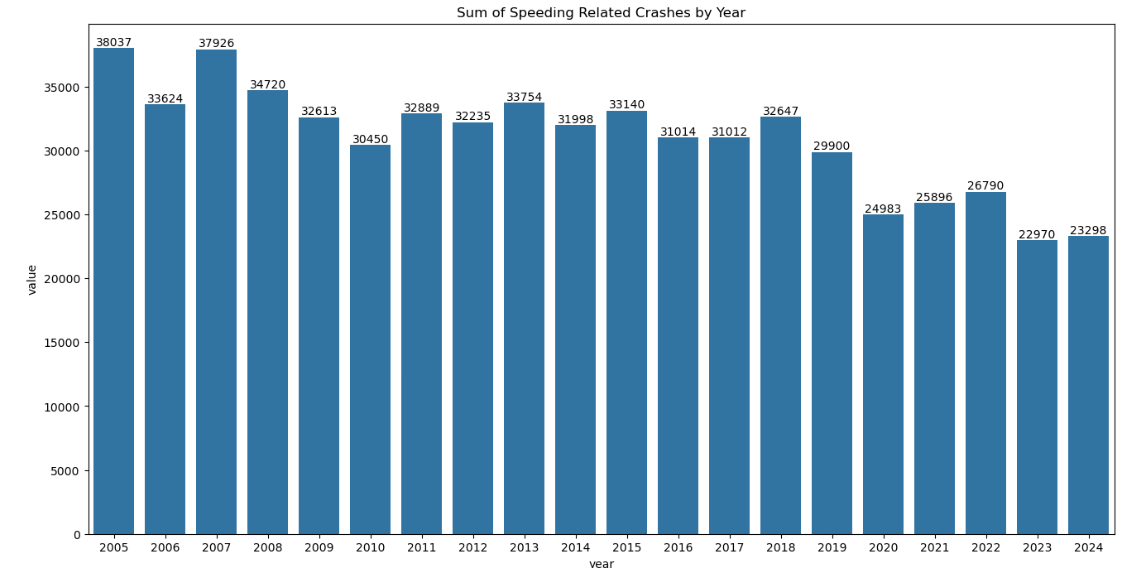
Before modeling, I performed preliminary data exploration. I calculated the total number of crashes and visualized crashes per year and crashes per year with a specific driver behavior using bar charts. These charts helped to show overall trends in crash rates and trends in driver behavior involved with crashes such as increased cell phone usage involved in car crashes and a reduced number of crashes involving speeding. Because the dataset included crash data from the past twenty years, it was also possible to see long-standing trends that have occurred over the past two decades as opposed to changes in crash rates specifically around the COVID-19 pandemic timeline.
Data Preparation
Firstly, the data needed to be combined into one dataset. The data was originally in separate tables by year, so I added a year variable and combined the relevant data into one dataset.
As mentioned above, I divided the crash rate by the vehicle miles travelled in units of 100 million. This means that the crash rate can be interpreted as crashes per 100 million vehicle miles traveled. I did this conversion for the overall crash rate and all crash rates involving specific driver behavior.
Models
I used two types of models: SARIMAX times series models and Difference-in-Difference models.
For both types of models, I created one model for the overall crash rate and crash rates involving specific driver behavior. This resulted in 26 SARIMAX models and 26 Difference-in-Difference models. I used loops to build each model, iterating through crash rate variables to create each model and output model metrics and a visualization.
Model Results and Interpretation
The SARIMAX models use past crash rate data to predict future crash rates. I used data leading up to 2020 to train the models and predict what crash rates would have been given the crash rates from previous years. I then compared this with the actual crash rates from following the COVID-19 pandemic to evaluate any differences between what the model predicts crash rates would have been without COVID, given pre-COVID trends, and what they actually were following the pandemic.
To make these models, I used the pmdarima package in python which tests multiple SARIMAX models and outputs the one with the best AIC. I did this for a model with overall crash rates and multiple models for crash rates involving specific driver behaviors, using loops to create models from multiple crash rates and output their results using one code block.
# Create SARIMA model with seasonality adjustment for months; Let model tind best (p,d,q)
columns= ['TOTAL_FATALITIES','AGGRESSIVE_DRIVING', 'ALCOHOL_RELATED', 'CELL_PHONE', 'DISTRACTED', 'DRINKING_DRIVER', 'DRUG_RELATED', 'DRUGGED_DRIVER', 'FATAL', 'FATIGUE_ASLEEP', 'ILLEGAL_DRUG_RELATED', 'IMPAIRED_DRIVER', 'IMPAIRED_NONMOTORIST', 'INJURY', 'MARIJUANA_DRUGGED_DRIVER', 'MARIJUANA_RELATED', 'MATURE_DRIVER', 'MC_DRINKING_DRIVER', 'OPIOID_RELATED', 'SPEEDING', 'SPEEDING_RELATED', 'TAILGATING', 'URBAN', 'YOUNG_DRIVER', 'UNBELTED']
#identify y as crashrate
for variable in columns:
y = Crash_Rates_All[variable]
train = y[y.index < '2020-03-01']
test = y[y.index >= '2020-03-01']
model = pm.auto_arima(
train,
seasonal=True,
m=12,
trace=True,
error_action='ignore',
suppress_warnings=True,
stepwise=True)
print(model.summary())
# Based on Model, predict post-covid crash rate
n_periods = len(test)
forecast, conf_int = model.predict(n_periods, return_conf_int=True)
forecast_index = test.index
forecast_series = pd.Series(forecast, index=forecast_index)
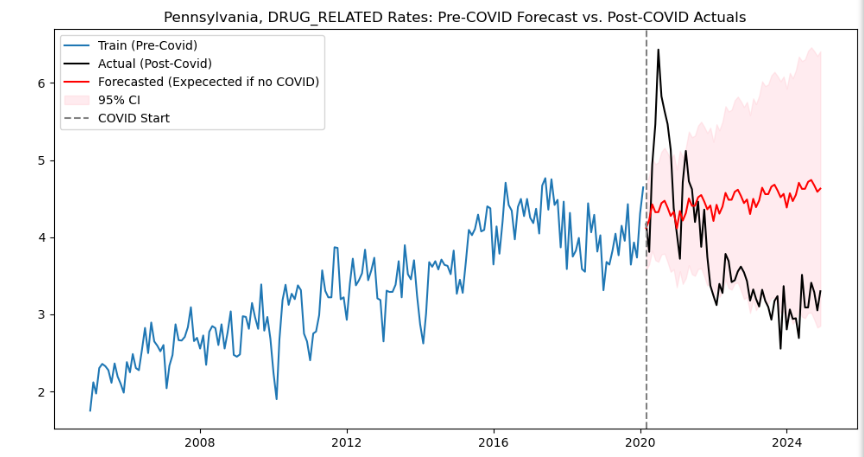
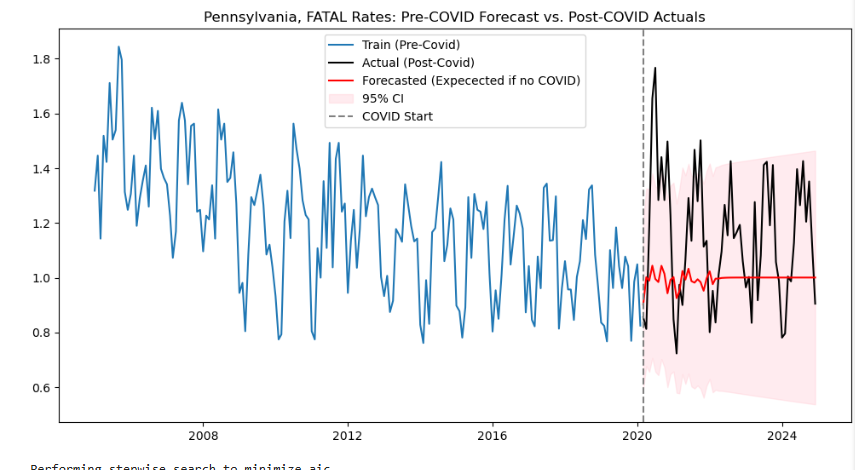
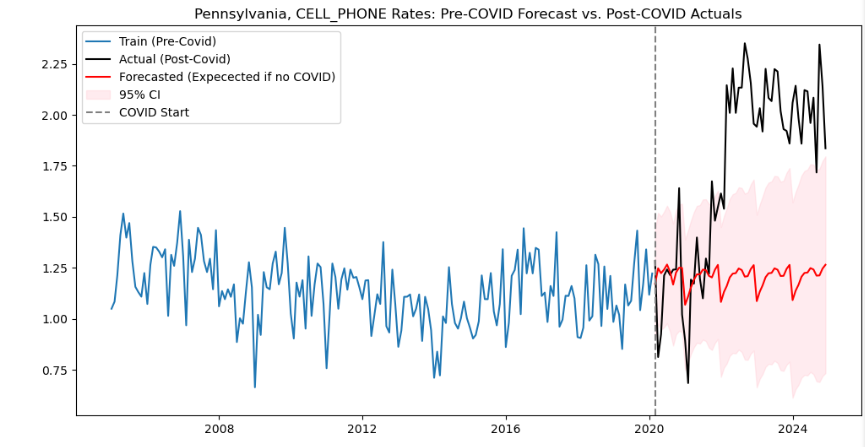
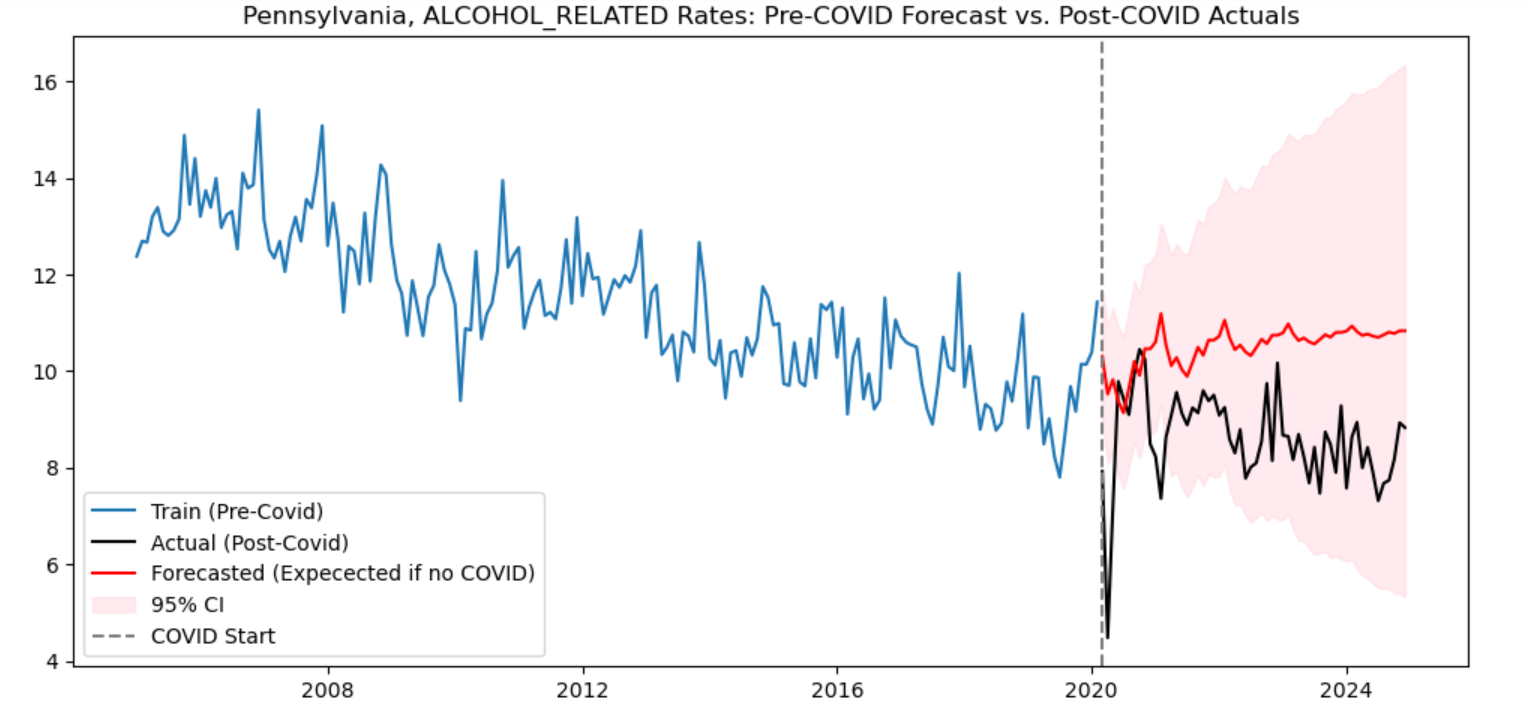
title = f"Pennsylvania, {variable} Rates: Pre-COVID Forecast vs. Post-COVID Actuals"
plt.figure(figsize=(12,6))
plt.plot(train.index, train, label='Train (Pre-Covid)')
plt.plot(test.index, test, label='Actual (Post-Covid)', color='black')
plt.plot(forecast_index, forecast_series, label='Forecasted (Expecected if no COVID)', color='red')
plt.fill_between(forecast_index, conf_int[:, 0], conf_int[:, 1], color='pink', alpha=0.3, label='95% CI')
plt.axvline(pd.Timestamp('2020-03-01'), color='gray', linestyle='--', label='COVID Start')
plt.legend()
plt.title(title)
plt.show()
plt.savefig(f"{variable}_sarimax.png")For some behavior-specific crash rates the actual and predicted values were similar, showing that COVID likely did not correlate with any change in those driver behaviors. However, other behavior-specific crash rates showed noticeable deviations from the expected rates. These included drug-related crashes, crashes involving cell-phone usage, crashes involving alcohol, and fatal crashes. All of the actual crash rates involving these crash characteristics were higher than predicted except for the crash rate involving alcohol usage, which was lower than predicted. The outputs of these models helped to show which driver behaviors may have worsened post-COVID but also indicated that some driver behaviors may have improved.
The Difference-in-Difference models attempt to measure the causality of the pandemic on changes in driver behaviors measured by crash rates. Similar to the SARIMAX models, I made these models for the overall crash rate and crash rates involving specific driver behavior, using loops to create the models.
    models_info = []
for variable in variables:

    print(variable)

    model = smf.ols(
        formula = f"{variable} ~ post + Treated + did + C(county_name) + C(year)",
        data = county_crash_data
    ).fit(cov_type='cluster', cov_kwds={'groups': county_crash_data['county_name']})

    print(model.summary())

    model_info = {"Model": variable,
    "R-Squared": model.rsquared,
    "DiD_PValue": model.pvalues['did'],
    "DiD_Coeff": model.params['did']}
    models_info.append(model_info)

    avg = county_crash_data.groupby(['Treated', 'post'])[variable].mean().reset_index()

    plt.figure(figsize=(7,5))
    for treated in [0,1]:
        subset = avg[avg['Treated'] == treated]
        label = "Treated (more affected) " if treated == 1 else "Control (less affected)"
        plt.plot(subset["post"], subset[variable], marker='o', label=label)

    plt.xticks([0,1], ['Pre-COVID', 'Post-COVID'])
    plt.ylabel(variable)
    plt.title(f"Difference-in-Difference: {variable}-Related Crashes in Pennsylvania")
    plt.legend()
    plt.show()
Most of the models did not show any statistically significant changes in driver behavior as a result of the COVID-19 pandemic, except for a few, which noted decreases in crash rates. This could be interpreted by saying the COVID pandemic caused improvements to crash rates and driver behavior involved in crashes. However, when viewing the downward trend is crashes overall over the past twenty years, even with statistically significant causal models, it is more likely that the improvement in the crash rate is due to a continuous trend in reduced crashes over the past two decades. To test this, I performed the DiD models again, this time using only data from the past ten years, making the downward trend in crashes less significant. Using this data, none of the models were statistically significant. Therefore, I would use the results of the DiD models to conclude that there is not enough evidence to determine that COVID has had any effect on driver behavior but driver behavior as indicated by crash rates has been improving over the past twenty years.
It is notable that the methodology for selecting a control group for the DiD models was not perfect. The results of the DiD models would be more robust and impactful if a better method for identifying control group counties was employed, and the DiD models should be interpreted with that in mind.
Key Findings Summary
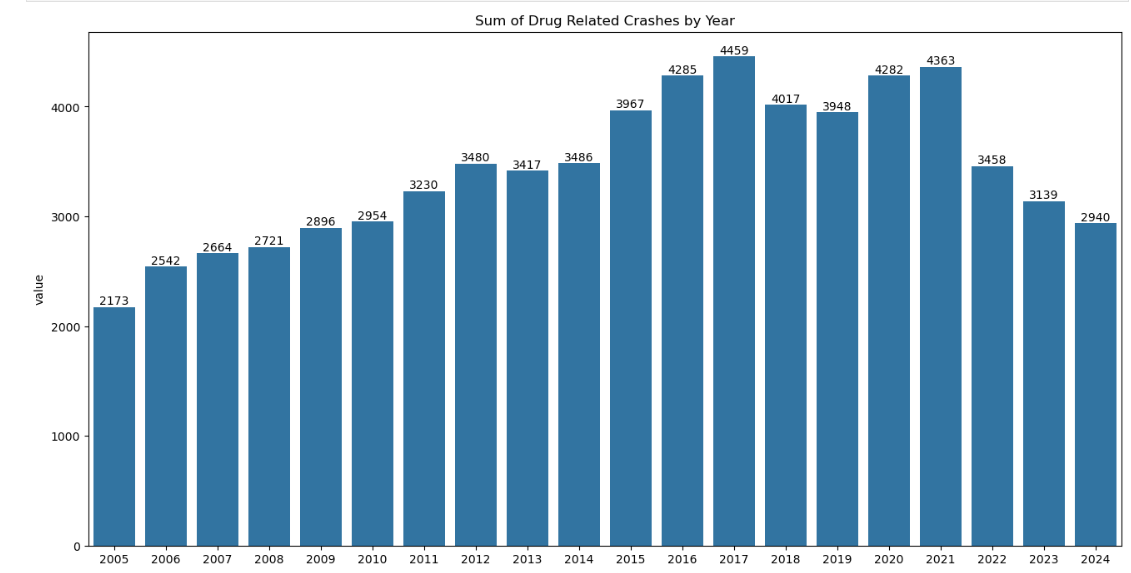
There is not enough evidence to conclude that driver behavior has worsened since the COVID-19 pandemic, and by some metrics, driving behavior has even improved. The SARIMAX models found that drug-related crashes spiked right at the onset of the COVID-19 pandemic, which could explain perceived worsened driving behavior at the beginning of the pandemic. About two years after the pandemic began, there was a significant increase in crashes involving cell phone usage, which may explain the continued perception that driving behavior has worsened since the COVID-19 pandemic.
Many crash rates such as crashes involving drinking and driving or an impaired motorist have improved since the COVID pandemic. However, the data does not suggest that COVID was the cause of these improvements, but rather, these crash rates had already been on a downward trend over the past few decades.